Active Metrics
Analytics & Training Load
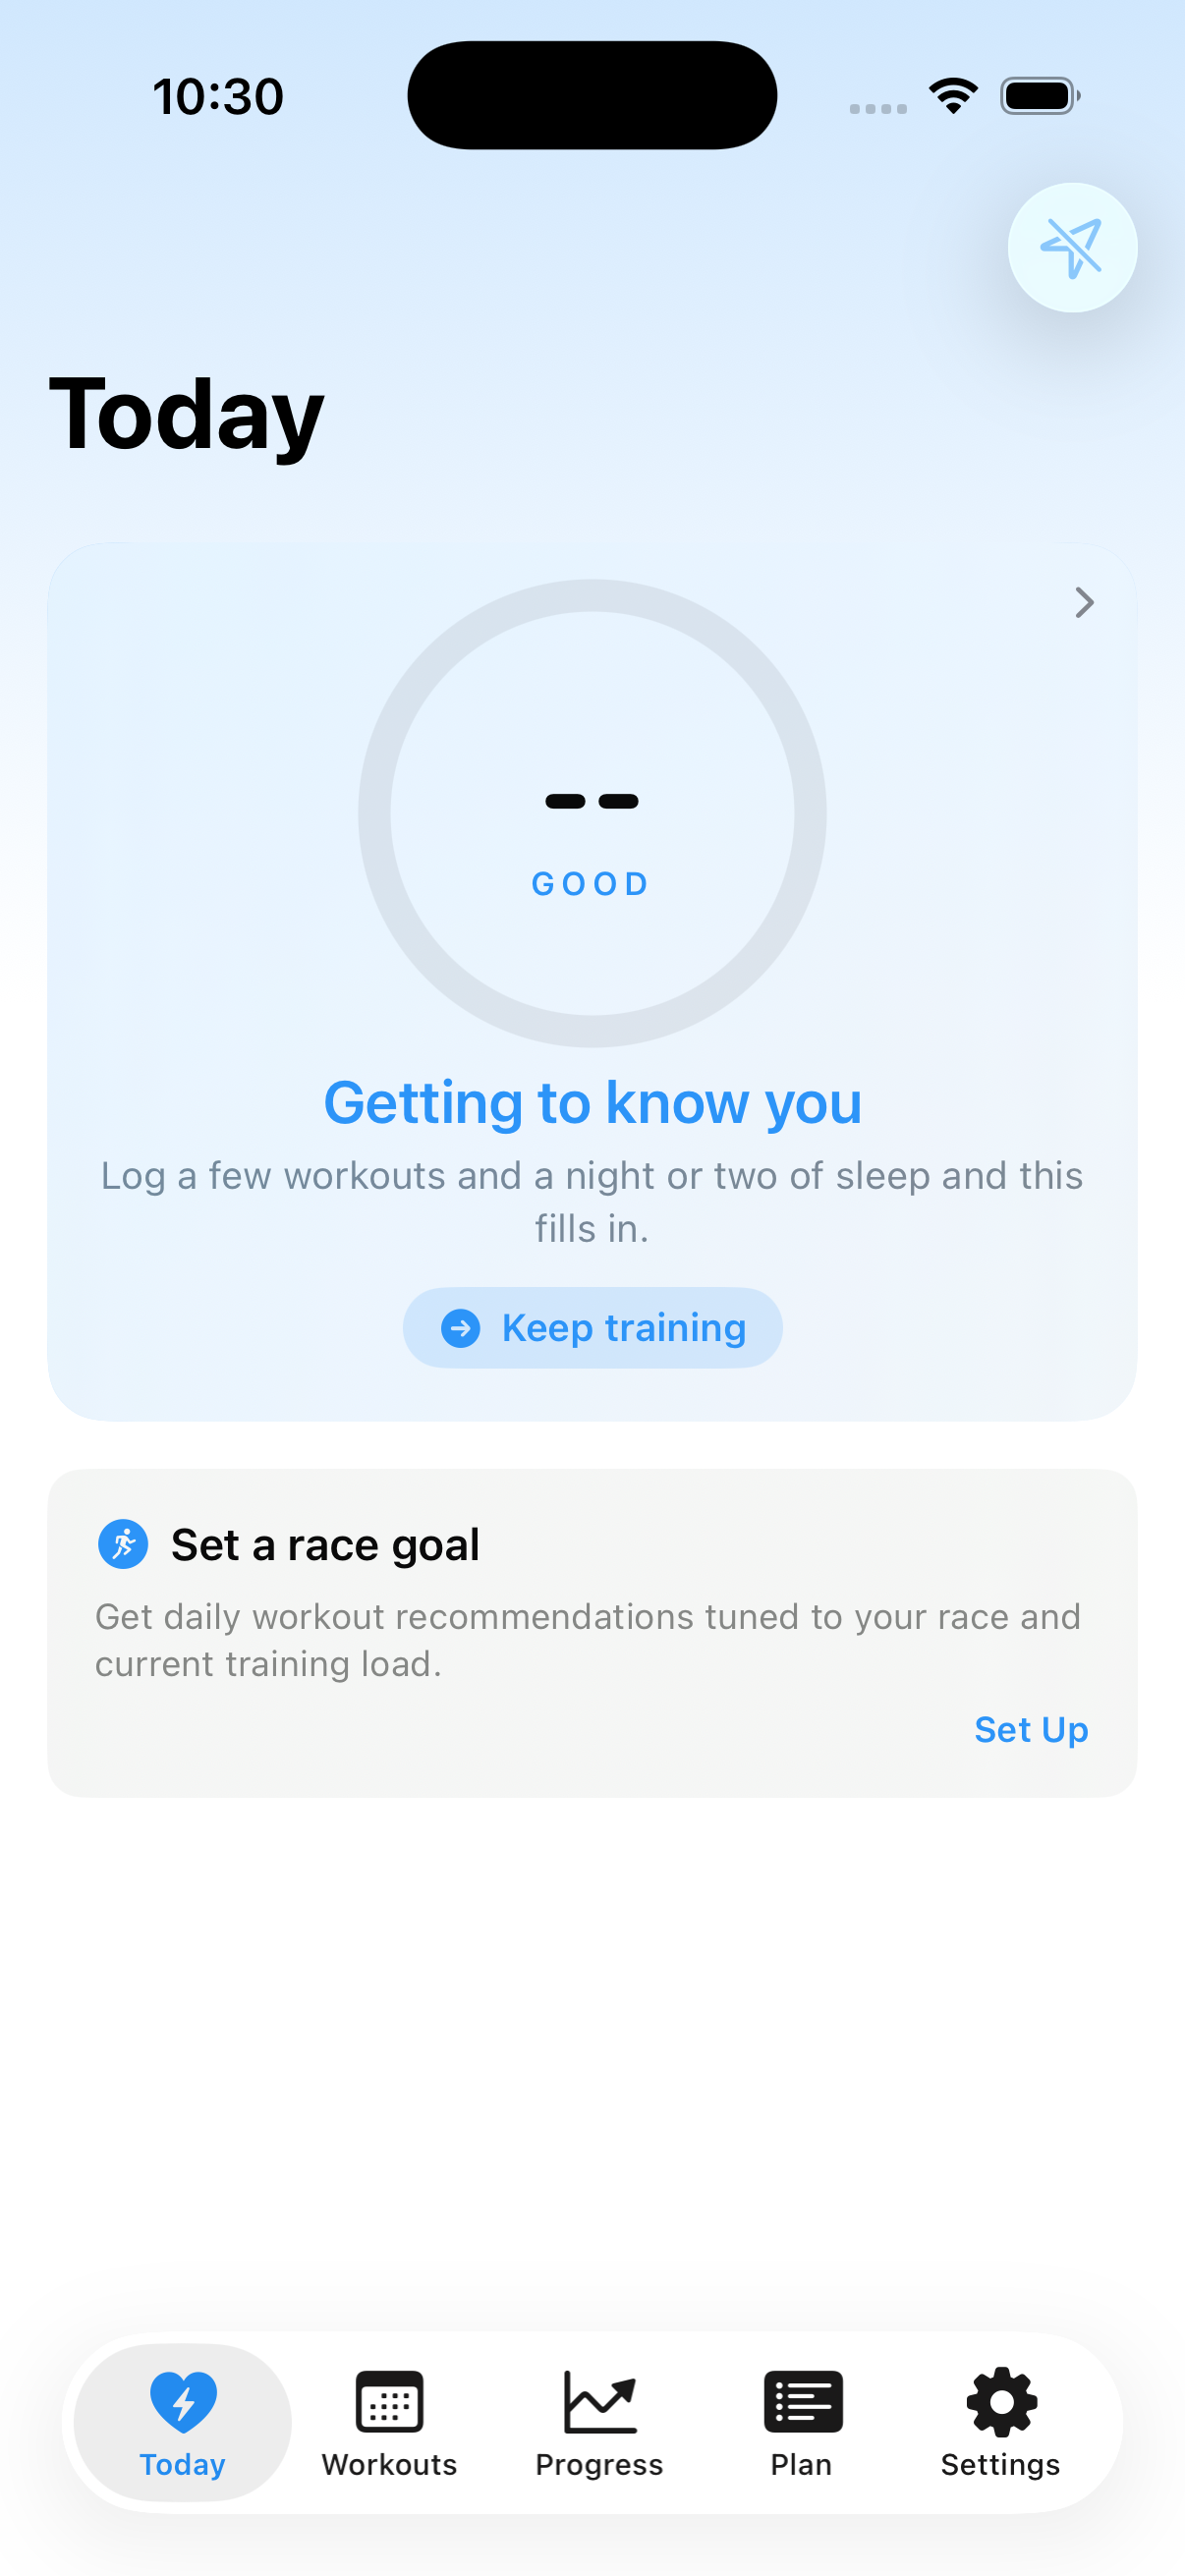
Active Metrics answers two questions on the phone: “how am I right now?” (the Today tab) and “am I improving?” (the Progress tab). Both are built from your workouts plus the recovery data your watch already collects — sleep, HRV, resting heart rate.
Both tabs are Active Metrics Pro features, along with the readiness rings, coaching, and everything on Progress. See the FAQ.
The Today tab
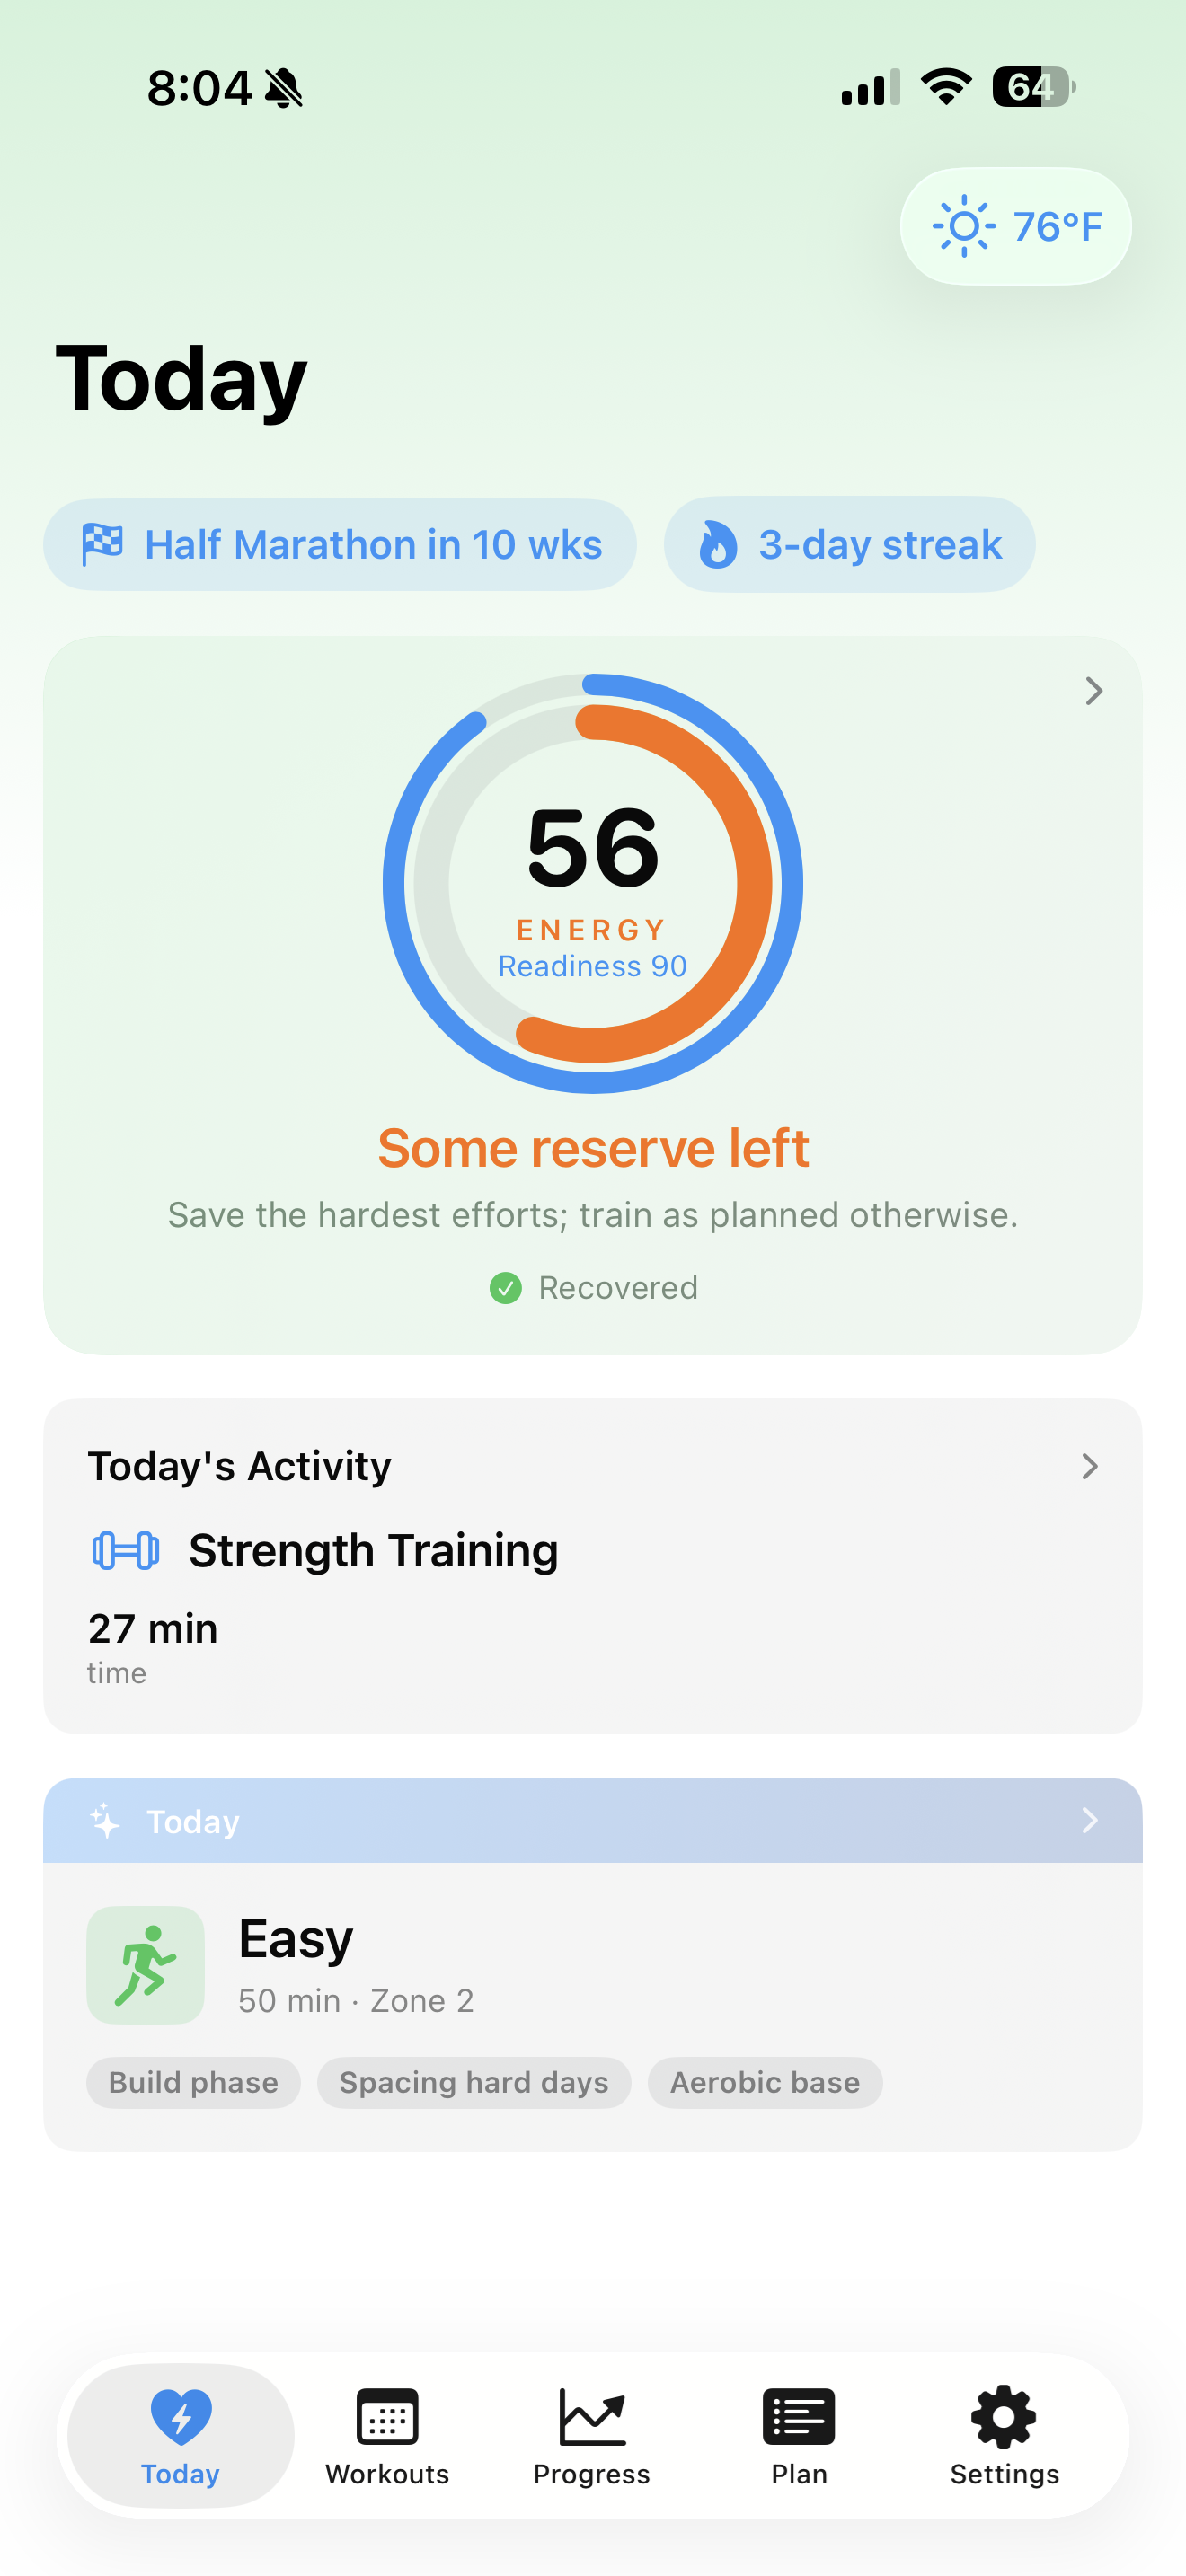
The hero is a pair of rings:
- Readiness (outer ring, 0–100) is your morning ceiling — how prepared your body is for hard work today. It blends overnight HRV, sleep, and resting heart rate with your recent training load.
- Energy (inner ring) is the live tank. It starts the day at your readiness anchor, drains a little for every hour you’re awake and more for the training you log, and recharges overnight. After a hard morning run, readiness still shows what you woke up with; energy shows what’s left.
Below the rings, a Recovering countdown estimates when you’ll be ready for the next hard session — bigger workouts dig a deeper hole, and a good or rough night shrinks or stretches it. Easy movement while recovering is fine; it’s the hard days that wait.
Tap the hero for the full breakdown: where today’s energy went, how the recovery countdown was computed, and which signals (HRV, sleep, resting HR, form, recent effort) lifted or dragged the readiness score.
Also on the tab: a workout streak chip, a weather button showing current running conditions, and — once you set a race goal — a Today card with the coach’s recommended workout for the day. Completed the plan? The card flips to “Done for today” and previews tomorrow.
The Progress tab
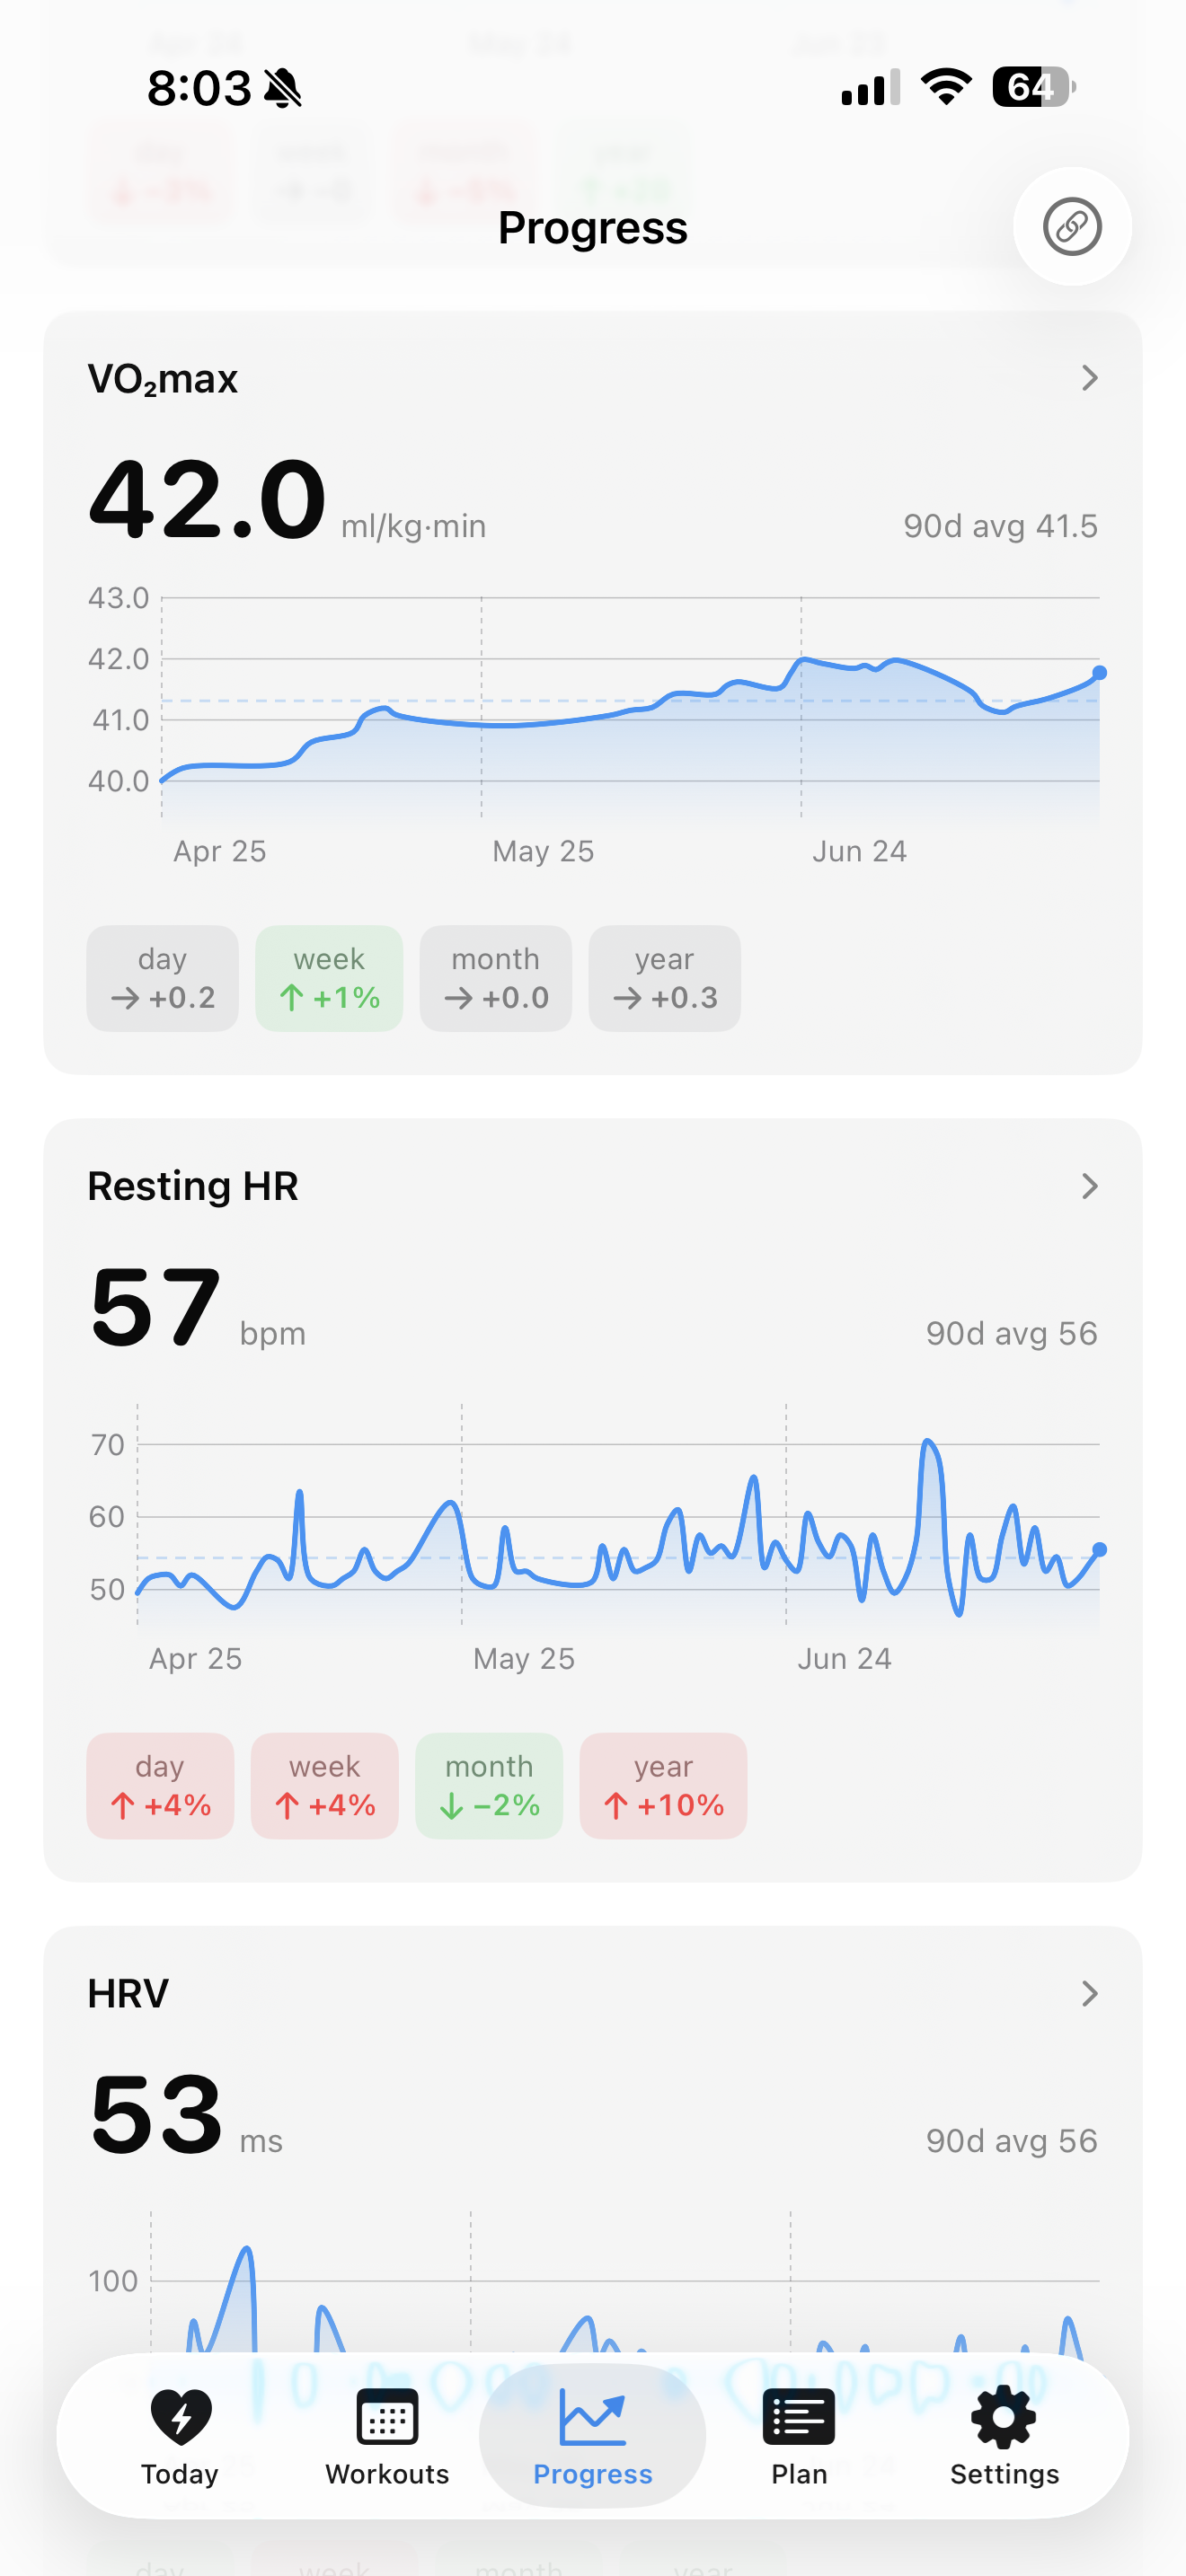
The link icon in the toolbar links every chart on the page: scrub one and they all pin to the same day.
Training Status
The hero at the top of the tab is one verdict on the last four weeks — the answer to “is what I’m doing working?”:
- Productive — load is building or holding, and the outcome markers agree.
- Maintaining — load and outcomes are both flat. You’re holding the fitness you built.
- Strained — recovery signals say the work is landing harder than you’re absorbing it.
- Unproductive — the work is going in, but VO₂max and efficiency are drifting the wrong way.
- Recovering — a deliberate step back off a peak: load down, freshness returning.
- Detraining — load has fallen far enough, for long enough, to cost fitness.
- No status yet — not enough history to call a direction.
Tap it for the metrics behind the call. The verdict reads month-over-month, so it won’t flip on a single good or bad week.
Training Load
Three numbers, in plain words:
- Fitness (CTL) — a 42-day weighted average of daily training load: how much work your body has absorbed over roughly the last six weeks.
- Fatigue (ATL) — the same idea over a short window: how much you’ve done recently.
- Form (TSB) — fitness minus fatigue. Deep negative means you’re overreaching; positive means you’re rested and race-ready.
A pill under the numbers labels your current fatigue-to-fitness ratio — Optimal, High load, Overreaching, or Detraining — and a Zones view shows where your recent training time landed.
A workout only counts toward load if it has heart-rate data — load is computed from time spent at elevated heart rate, so a workout with no HR contributes nothing. The card tells you when workouts were skipped for this reason; check that Active Metrics can read Heart Rate in Apple Health.
Trends
Delta cards for Fitness, VO₂max, Resting HR, HRV, HR Recovery, and Efficiency, each tappable for history plus a plain-language explainer. The short version:
- VO₂max — the most oxygen your body can use per minute, estimated by your watch from runs. The strongest single marker of aerobic fitness; judge the multi-month direction, not the weekly wobble.
- Resting HR — down is the good direction; a sudden jump can flag fatigue, illness, or stress.
- HRV — higher usually means better recovery. Compare against your own baseline, never someone else’s.
- HR Recovery — how far your heart rate falls in the first minute after stopping. Watch-recorded workouts only; imports carry no post-workout heart rate.
- Efficiency — distance per heartbeat. A rising 28-day trend means your aerobic economy is improving.
Adaptation, Volume, Records
Adaptation scores your last 28 days of heat, cold, endurance, and hill exposure, 0–100 each. Your body specializes to what you repeatedly do; the scores decay if you stop, so consistency holds them up.
Volume is your weekly totals across the last six weeks. Steady or gently rising is the goal — big spikes raise injury risk, and smooth beats heroic.
Records are your personal bests — fastest 5K through marathon, longest run and ride, biggest climb and week. New records show a banner on the workout that set them.
Recovery and Performance
Sleep charts your recent nights against a 7.5-hour target alongside resting heart rate — wear your watch to bed to feed it. Race Predictions project finish times at standard distances from your recent best efforts; watch the predicted times drop over weeks.
Give it a few days
Nearly everything here needs history: training load wants a few weeks of workouts, readiness and energy want a few nights of sleep data, and adaptation builds over a month. A brand-new install will show empty cards — that’s expected, not broken. Give it a few days before judging.